Plot zscore v2
Examples
data_frame_zscore <- data.frame(
Lab = factor(c("A1", "A2", "A1", "A2", "A1", "A2")),
Sample = factor(c(1, 1, 2, 2, 3, 3)),
Type = rep("manual", 6),
Reference = c(2.56, 3.41, 4.54, 2.56, 3.41, 4.54),
Dose = c(2.589230, 2.610970, 3.146055, 3.018682, 4.259400, 3.989222),
Deviation = c(0.02922998, -0.79902999, -1.39394510, 0.45868228, 0.84939953, -0.55077813),
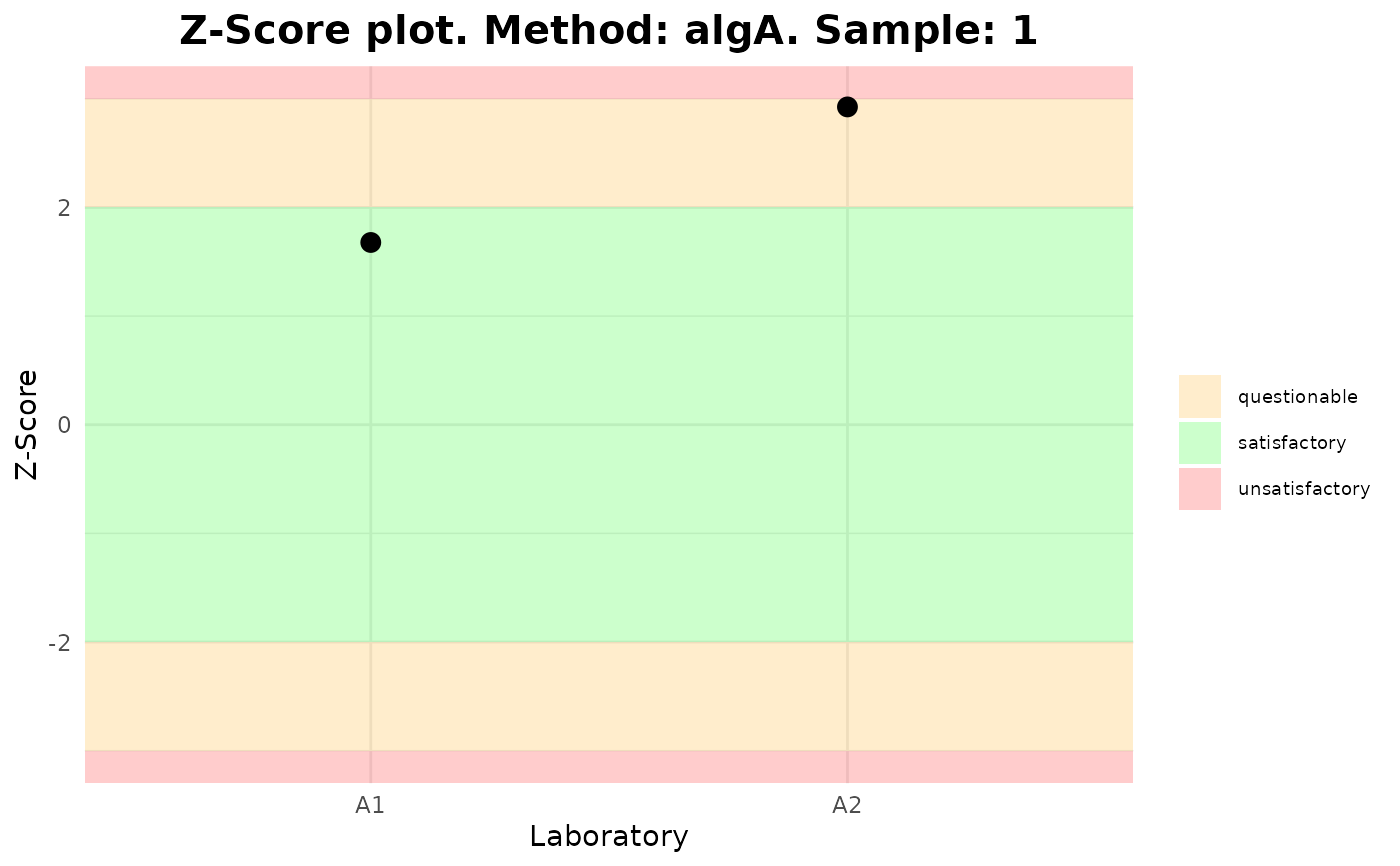
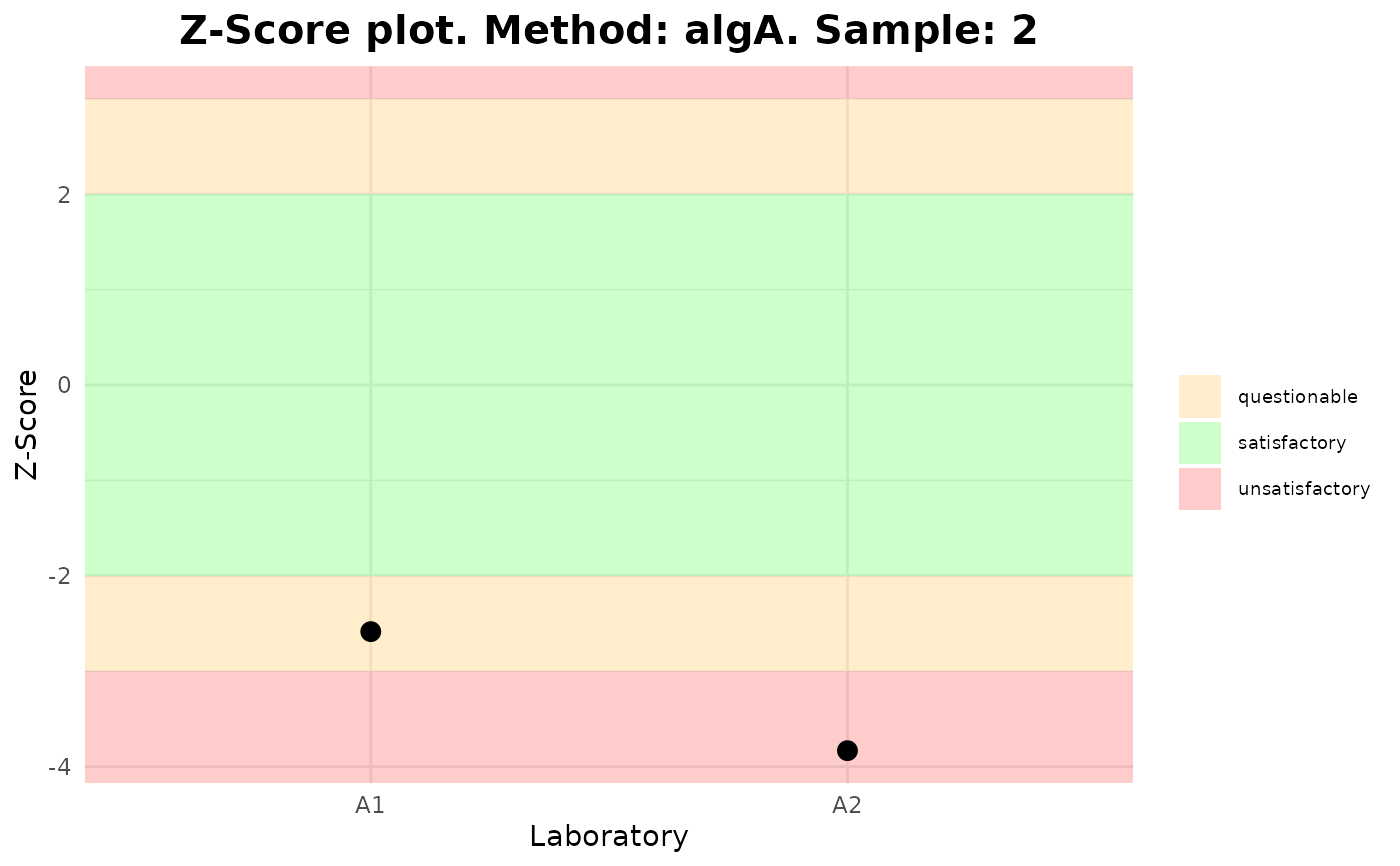
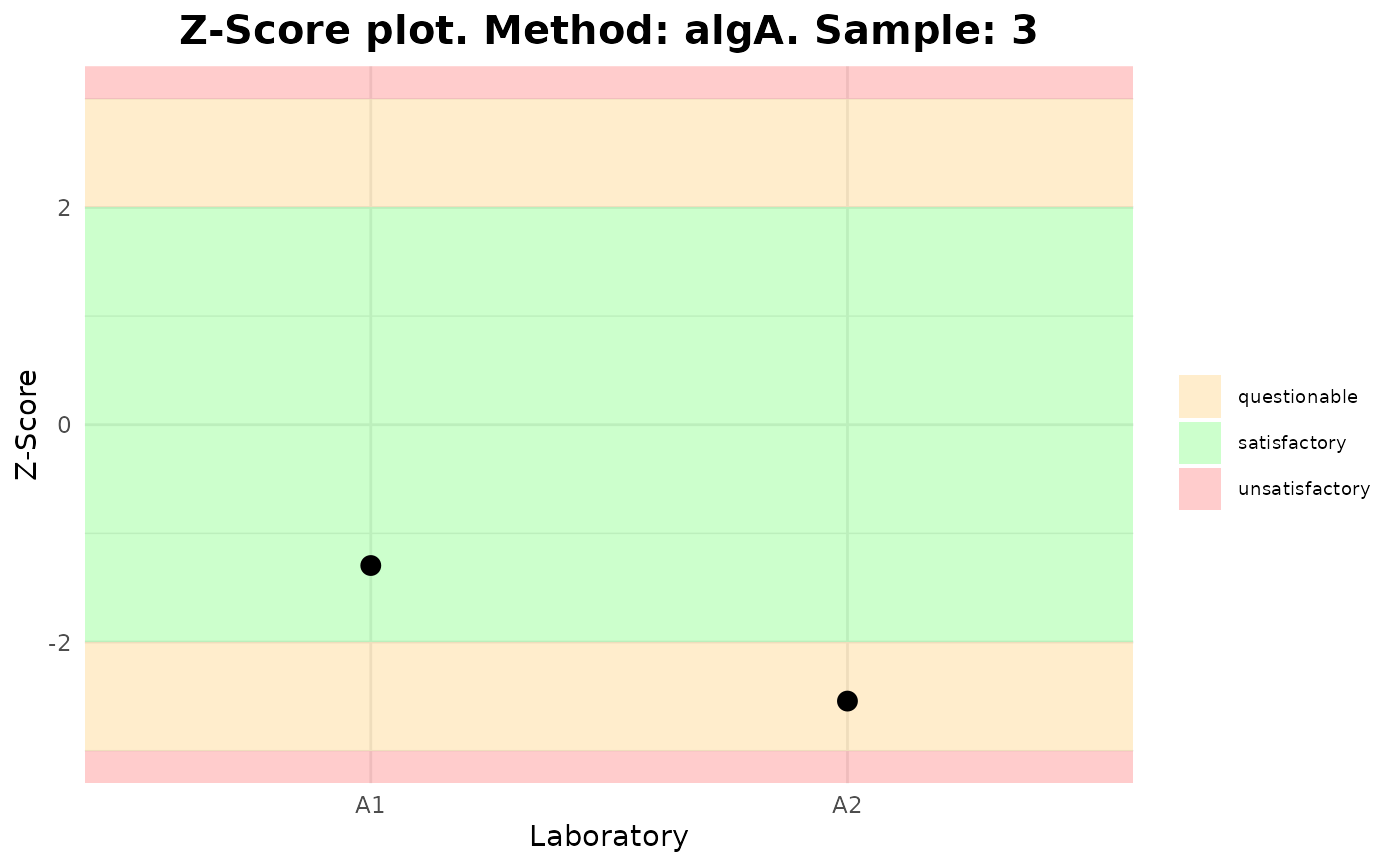
Zscore = c(1.677656, 2.925426, -2.585664, -3.833434, -1.295906, -2.543676),
stringsAsFactors = FALSE
)
sum_table <- data.frame(
Lab = c("A1", "A2", "A1", "A2", "A1", "A2"),
Module = c("dicentrics", "dicentrics", "dicentrics", "dicentrics", "dicentrics", "dicentrics"),
Type = rep("manual", 6),
Sample = c(1, 1, 2, 2, 3, 3),
N = c(200, 200, 200, 200, 200, 200),
X = c(140, 111, 204, 147, 368, 253),
estimate = c(2.589230, 2.610970, 3.146055, 3.018682, 4.259400, 3.989222),
lower = c(2.083403, 2.231150, 2.614931, 2.622748, 3.882349, 3.552963),
upper = c(3.208857, 3.045616, 3.785879, 3.471269, 4.688910, 4.487336),
y = c(0.700, 0.555, 1.020, 0.735, 1.840, 1.265),
y.err = c(0.0610, 0.0495, 0.0733, 0.0556, 0.0923, 0.0785),
DI = c(1.0625, 0.8818, 1.0539, 0.8406, 0.9255, 0.9731),
u = c(0.6252, -1.1840, 0.5389, -1.5951, -0.7442, -0.2692),
stringsAsFactors = FALSE
)
#FUNCTION PLOT_INTERLAB_V2
plot_interlab_v2(zscore = data_frame_zscore,
select_method = "algA",
sum_table = sum_table,
place = "UI"
)
#> [[1]]
 #>
#> [[2]]
#>
#> [[2]]
 #>
#> [[3]]
#>
#> [[3]]
 #>
#>