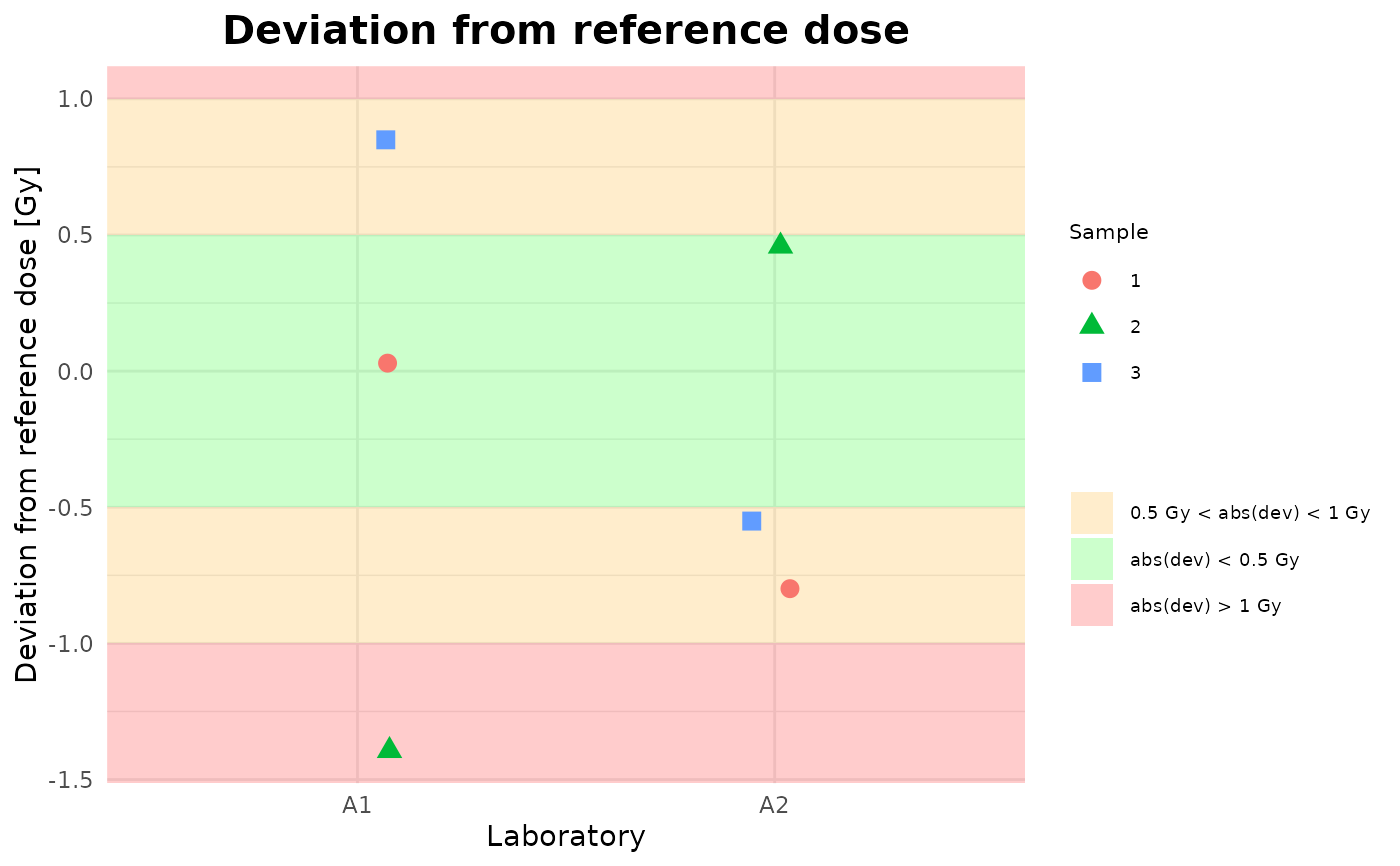
Plot Deviaition from ref dose all blind samples
Examples
data_frame_zscore <- data.frame(
  Lab = factor(c("A1", "A2", "A1", "A2", "A1", "A2")),
  Sample = factor(c(1, 1, 2, 2, 3, 3)),
  Type = rep("manual", 6),
  Reference = c(2.56, 3.41, 4.54, 2.56, 3.41, 4.54),
  Dose = c(2.589230, 2.610970, 3.146055, 3.018682, 4.259400, 3.989222),
  Deviation = c(0.02922998, -0.79902999, -1.39394510, 0.45868228, 0.84939953, -0.55077813),
  Zscore = c(1.677656, 2.925426, -2.585664, -3.833434, -1.295906, -2.543676),
  stringsAsFactors = FALSE
)


plot_deviation_all(
  zscore = data_frame_zscore,
  select_method = "algA",
  place = "UI"
)